
Scientific projects
Contents
- Two point anisotropic raytracing and location of microseismicity in shales
- Location of microseismic events induced by hydraulic fracturing using single vertical borehole array
- Micoseismic reflection imaging of a hydraulic reservoir stimulation
- Microseismic imaging using a single geophone
- Seismic imaging using natural microearthquakes as a seismic sources
- Permeability estimation at KTB from fluid injection-induced microseismicity
- Modelling of direct and single-reflected waves for 3D layered model
- Inverse Kinematic Problem for VSP data
- Dynamic decomposition of the wavefield and reconstruction of the media
Two point anisotropic raytracing and location of microseismicity in shales
Location of hydraulic fracturing induced microseismic events using single vertical borehole array
09/2011–11/2011
In this study we analyse the microseismic data induced by hydraulic fracturing recorded at single vertical downhole sensor array. The aim was to analyse the data, to build a velocity model and to locate the events. In order to build and calibrate a velocity model we used sonic logs and the data from perforation shots. We performed an optimisation of velocities and Thompsen anisotropy parameters using fitting the perforation shots locations. We constructed four isotropic and anisotropic velocity models and located the corresponding microseismic clouds. Finally, we present an evaluation of the results and suggestions how to further constrain this problem. .
Micoseismic reflection imaging of a hydraulic reservoir stimulation
09/2010–02/2012
The Microseismic Reflection Imaging approach was applied to the Basel 1 data recorded at two different borehole instruments, 2.5 km and 4.3 km away from the injection interval. Both imaging results complement each other and show the same structure of reflectors within the stimulated reservoir. .
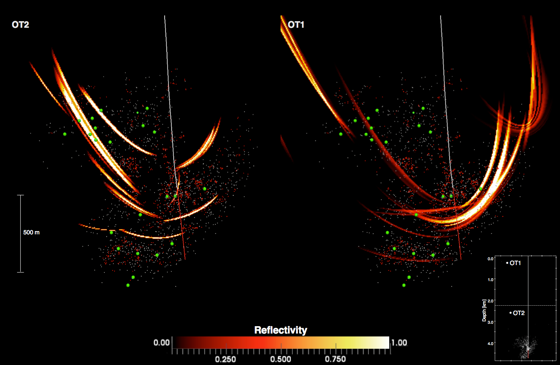
Vertical sections of the obtained images for OT2 (left) and OT1 (right) stations. White solid line - borehole, red dots - clustered events, white dots - non clustered events, green dots - big events, red solid line - borehole open hole section.
Microseismic imaging using a single geophone
06/2009–09/2010
Application of the microseismic reflection imaging to the data obtained from the German Continental Deep Drilling program (KTB project). This is a continuous data stream containing induced microseismicity data recorded at a single 3C geophone located at approximately 3.5 km depth. Using P and S time picks we have located 414 microseismic events using data from the borehole geophone and from near-surface stations. Since microearthquakes occur not at the same time, it is possible to separate continuous data stream recorded at the receiver to the number of 3C traces containing waveforms from different events. Using these traces I produced seismic gather for the microseismicity cloud. Using the Fresnel-Volume-Migration approach the high resolution 3D image of the seismic data between P- and S- direct waves was constructed. There was a complex network of reflectors revealed within the microseismicity cloud which belong to large scale fault zone.
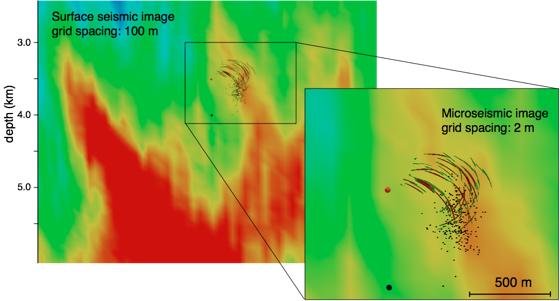
Comparison of seismic attributes obtained from surface imaging results (on the background) and images from 414 microseismic events (thin curved lines). Red point – HBU geophone position, black points – microseismic cloud.
Seismic imaging using natural microearthquakes as a seismic sources
09/2007–06/2009
Development of a new passive seismic reflection imaging approach which consists of two steps. First, the hypocenter of the microseismic event is precisely located. Second, this event is treated as a "pseudo-active" seismic source and the reflections within the recorded wavefield are processed by using a directional migration algorithm in order to construct a high resolution image of the illuminated subsurface region. This approach was applied to a number of microseismic events recorded by a borehole array in the SAFOD (San-Andreas-Fault-Observatory-at-Depth) main hole. Results obtained were high-resolution 3D images of different SE-NW oriented reflectors related to the SAF system in the close vicinity of the borehole.
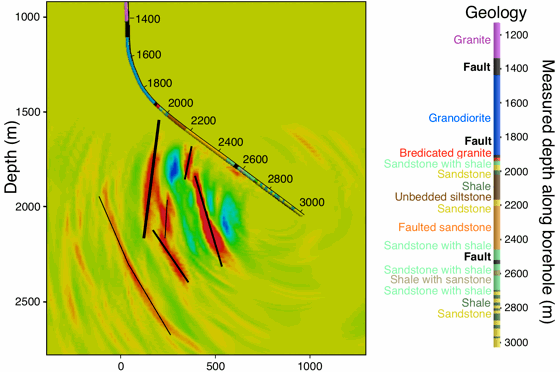
Vertical component of the image obtained from several microearthquakes and its correlation with lithology. Solid lines represent supposed reflectors map.
Permeability estimation at KTB from fluid injection-induced microseismicity
03/2010
Using seismicity based reservoir characterization (SBRC) approach the hydraulic permeability for three fluid injection experiment stages at KTB was estimated, at depth 4 km, 5.4k m and 9 km which is consistent with first fault zone, background rocks and second fault zone respectively. Then assuming correlation between seismic reflectivity and permeability we have constructed the permeability model from the reflectivity cube obtained by the surface seismic imaging.
Obtained permeability cube slices. Left: fault perpendicular vertical slice, right: horizontal slice at depth 3.5 km.
Modelling of direct and single-reflected waves for 3D layered model
03/2007–08/2007
Responsible for product architecture and development
Development of the program for ray-tracing based 3D modelling of the kinematical and dynamical characteristics of the direct and single reflected waves for VSP acquisition systems. The program was developed in the frame of the contract with BGP, China.
Velocity model and the result of modelled wavfield.
Inverse Kinematic Problem for VSP data
06/2004–05/2007
Responsible for product architecture and design.
Development of the method of 2D velocity model estimation using VSP travel times. The model is represented by a number of layers with smooth interfaces defined by cubic splines. Each layer is defined by the P and S velocities and its vertical gradients. The method consists of three steps: construction of the first order 1D model, construction of the model with the interfaces represented in form of the second or third order polynomial functions and construction of the model with spline boundaries and gradient velocities. The program was included into the commercial software package.
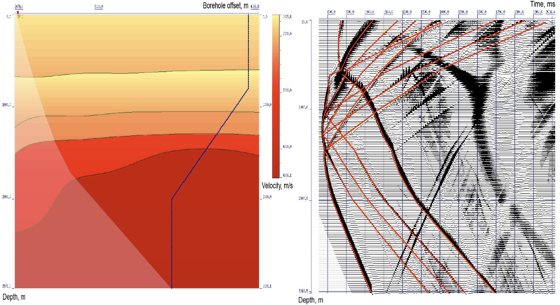
Reconstructed velocity model and wavefield with the modelled travel times.
Dynamic decomposition of the wavefield and reconstruction of the media
06/2002–09/2005
responsible for the design and implementation of the computational part.
Implementation of the interactive tool for velocity model correction, ray-tracing, and imaging of the reflected waves of different types, including multiples. The program is a part of VSP seismic processing and interpretation software UNIVERS.
Concept of simultaneous iterative processing-interpretation of seismic data. Screenshot of the software product. Left: wavefield, right: corresponding 2d model.
Contact Info
- Email:[email protected]
- Location:Singapore
Status: Interested in collaboration and full-time oportunities